File:Analytic.png

File originale (1 250 × 875 pixel, dimensione del file: 86 KB, tipo MIME: image/png)
| Questo file e la sua pagina di descrizione (discussione · modifica) si trovano su Wikimedia Commons (?) |

|
File:Analytic.svg è una versione vettoriale di questo file. Dovrebbe essere usata quella versione al posto di questo file PNG.
File:Analytic.png → File:Analytic.svg
Per maggiori informazioni, vedi Help:SVG. |
 |
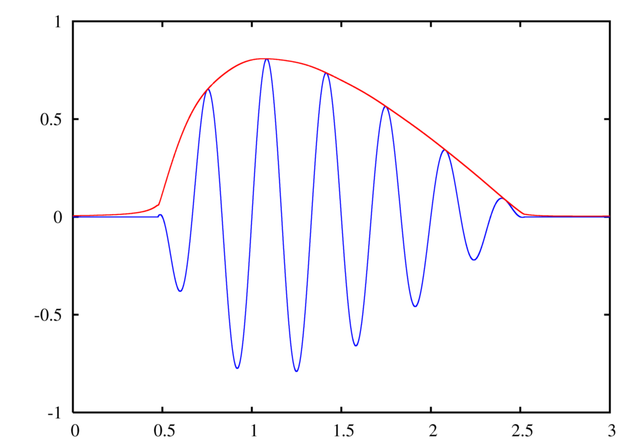
A signal and the magnitude of its analytic signal, to demonstrate the envelope effect, made with GNU Octave.
Instructions
See Wikipedia graph-making tips.
These can be copied and pasted, saved to the Octave work directory as a .m file (such as analytic.m), and executed by typing the name of the file: analytic.
To convert the PostScript file to PNG:
- Open it in the GIMP (make sure you have ghostscript installed! - Windows instructions)
- Enter 500 under Resolution (it doesn't say "DPI" but I think that's what it means)
- Uncheck Try bounding box (since the bounding box cuts off the edge, unfortunately. You can try with the bounding box first.)
- Enter large values for Width and Height
- Check Color
- Check Strong anti-aliasing for both graphics and text
- Crop off extra whitespace (Shift+C if you can't find it in the toolbox)
- Possibly need to rotate it: Click Image → Transform → Rotate 90 degrees clockwise
Filters → Blur → Gaussian blur at 2.0 px(No need to blur if you use strong anti-aliasing during conversion. I see no significant difference between end results.)- Image → Scale Image...
- Width and Height at 25%
- Cubic interpolation
- You can view at normal size if you want by pressing 1, Ctrl+E
- Save as Analytic.png
Created by User:Omegatron using gnuplot, possibly with post-processing in the GIMP (PNG) or Inkscape (SVG)
- Tu sei libero:
- di condividere – di copiare, distribuire e trasmettere quest'opera
- di modificare – di adattare l'opera
- Alle seguenti condizioni:
- attribuzione – Devi fornire i crediti appropriati, un collegamento alla licenza e indicare se sono state apportate modifiche. Puoi farlo in qualsiasi modo ragionevole, ma non in alcun modo che suggerisca che il licenziante approvi te o il tuo uso.
- condividi allo stesso modo – Se remixi, trasformi o sviluppi il materiale, devi distribuire i tuoi contributi in base alla stessa licenza o compatibile all'originale.

|
È permesso copiare, distribuire e/o modificare questo documento in base ai termini della GNU Free Documentation License, Versione 1.2 o successive pubblicata dalla Free Software Foundation; senza alcuna sezione non modificabile, senza testo di copertina e senza testo di quarta di copertina. Una copia della licenza è inclusa nella sezione intitolata Testo della GNU Free Documentation License. |
(In short, this means that you can copy and modify the image freely as long as you provide attribution; preferably in the form of a link back to this page.)
Cronologia del file
Fare clic su un gruppo data/ora per vedere il file come si presentava nel momento indicato.
| Data/Ora | Miniatura | Dimensioni | Utente | Commento | |
|---|---|---|---|---|---|
| attuale | 05:39, 6 lug 2005 | | 1 250 × 875 (86 KB) | Omegatron | updated now that I know pretty plots |
| 21:53, 26 giu 2005 |  | 563 × 371 (4 KB) | Omegatron | A graph or diagram made by User:Omegatron. (Uploaded with Wikimedia Commons.) Source: Created by User:Omegatron {{GFDL}}{{cc-by-sa-2.0}} Category:Diagrams\ |
Pagine che usano questo file
La seguente pagina usa questo file:
Utilizzo globale del file
Anche i seguenti wiki usano questo file:
- Usato nelle seguenti pagine di de.wikipedia.org:
- Usato nelle seguenti pagine di en.wikipedia.org:
- Usato nelle seguenti pagine di fr.wikipedia.org:
- Usato nelle seguenti pagine di ru.wiktionary.org:
- Usato nelle seguenti pagine di sr.wikipedia.org:
- Usato nelle seguenti pagine di vi.wiktionary.org: