File:Moebius Surface 1 Display Small.png
Vai alla navigazione
Vai alla ricerca
Non sono disponibili versioni a risoluzione più elevata.
Moebius_Surface_1_Display_Small.png (180 × 140 pixel, dimensione del file: 16 KB, tipo MIME: image/png)
| Questo file e la sua pagina di descrizione (discussione · modifica) si trovano su Wikimedia Commons (?) |

|
File:Moebius strip.svg è una versione vettoriale di questo file. Dovrebbe essere usata quella versione al posto di questo file PNG, quando sia migliore.
File:Moebius Surface 1 Display Small.png → File:Moebius strip.svg
Per maggiori informazioni, vedi Help:SVG. |
 |
| Descrizione |
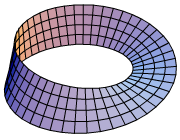
A moebius strip parametrized by the following equations:
where n=1. This plot is for display purposes by itself as a thumbnail. If you are looking for the image that is part of the sequence from n=0 to 1, see below for the other verison, along with a larger version (800px) of this image |
||
| Data | |||
| Fonte |
Self-made, with Mathematica 5.1 |
||
| Autore | Inductiveload | ||
| Licenza (Riusare questo file) |
|
||
| Altre versioni |


| Description | Moebius Strip, 1 half-turn (n=1) |
|---|---|
| Equation | :
|
| Co-ordinate System | Cartesian (Parametric Plot) |
| u Range | 0 .. 4π |
| v Range | 0 .. 0.3 |
Mathematica Code
| Please be aware that at the time of uploading (15:27, 19 June 2007 (UTC)), this code may take a significant amount of time to execute on a consumer-level computer. | 
|
| This uses Chris Hill's antialiasing code to average pixels and produce a less jagged image. The original code can be found here. | 
|
This code requires the following packages:
<<Graphics`Graphics`
MoebiusStrip[r_:1] =
    Function[
      {u, v, n},
      r {Cos[u] + v Cos[n u/2]Cos[u],
          Sin[u] + v Cos[n u/2]Sin[u],
          v Sin[n u/2],
          {EdgeForm[AbsoluteThickness[4]]}}];

aa[gr_] := Module[{siz, kersiz, ker, dat, as, ave, is, ar},
    is = ImageSize /. Options[gr, ImageSize];
    ar = AspectRatio /. Options[gr, AspectRatio];
    If[! NumberQ[is], is = 288];
    kersiz = 4;
    img = ImportString[ExportString[gr, "PNG", ImageSize -> (
      is kersiz)], "PNG"];
    siz = Reverse@Dimensions[img[[1, 1]]][[{1, 2}]];
    ker = Table[N[1/kersiz^2], {kersiz}, {kersiz}];
    dat = N[img[[1, 1]]];
    as = Dimensions[dat];
    ave = Partition[Transpose[Flatten[ListConvolve[ker, dat[[All, All, #]]]] \
& /@ Range[as[[3]]]], as[[2]] - kersiz + 1];
    ave = Take[ave, Sequence @@ ({1, Dimensions[ave][[#]],
    kersiz} & /@ Range[Length[Dimensions[ave]] - 1])];
    Show[Graphics[Raster[ave, {{0, 0}, siz/kersiz}, {0, 255}, ColorFunction ->
     RGBColor]], PlotRange -> {{0, siz[[1]]/kersiz}, {
  0, siz[[2]]/kersiz}}, ImageSize -> is, AspectRatio -> ar]
    ]

deg = 1;
gr = ParametricPlot3D[Evaluate[MoebiusStrip[][u, v, deg]],
      {u, 0, 4π},
      {v, 0, .3},
      PlotPoints -> {99, 3},
      PlotRange -> {{-1.3, 1.3}, {-1.3, 1.3}, {-0.7, 0.7}},
      Boxed -> False,
      Axes -> False,
      ImageSize -> 220,
      PlotRegion -> {{-0.22, 1.15}, {-0.5, 1.4}},
      DisplayFunction -> Identity
      ];
finalgraphic = aa[gr];

Export["Moebius Surface " <> ToString[deg] <> ".png", finalgraphic]
Cronologia del file
Fare clic su un gruppo data/ora per vedere il file come si presentava nel momento indicato.
| Data/Ora | Miniatura | Dimensioni | Utente | Commento | |
|---|---|---|---|---|---|
| attuale | 17:31, 19 giu 2007 | | 180 × 140 (16 KB) | Inductiveload | |
| 17:30, 19 giu 2007 |  | 200 × 150 (18 KB) | Inductiveload | ||
| 17:27, 19 giu 2007 |  | 200 × 150 (18 KB) | Inductiveload | {{Information |Description=A moebius strip parametrized by the following equations: :<math>x = \cos u + v\cos\frac{nu}{2}\cos u</math> :<math>y = \sin u + v\cos\frac{nu}{2}\sin u</math> :<math>z = v\sin\frac{nu}{2}</math>, where ''n''=1. This plot is for |
Pagine che usano questo file
La seguente pagina usa questo file:
Utilizzo globale del file
Anche i seguenti wiki usano questo file:
- Usato nelle seguenti pagine di el.wikipedia.org:
- Usato nelle seguenti pagine di en.wikipedia.org:
- Usato nelle seguenti pagine di en.wikiversity.org:
- Usato nelle seguenti pagine di eo.wikipedia.org:
- Usato nelle seguenti pagine di es.wikipedia.org:
- Usato nelle seguenti pagine di et.wikipedia.org:
- Usato nelle seguenti pagine di fr.wikipedia.org:
- Usato nelle seguenti pagine di ja.wikipedia.org:
- Usato nelle seguenti pagine di ru.wikipedia.org:
- Usato nelle seguenti pagine di simple.wikipedia.org:
- Usato nelle seguenti pagine di zh.wikipedia.org: