File:Temperature reconstruction last two millennia.svg

File originale (file in formato SVG, dimensioni nominali 485 × 325 pixel, dimensione del file: 134 KB)
| Questo file e la sua pagina di descrizione (discussione · modifica) si trovano su Wikimedia Commons (?) |
Dettagli

|
Questo file SVG contiene del testo che può essere facilmente tradotto nella tua lingua, utilizzando un editor che supporta SVG (ad esempio un editor XML o di testo). Per maggiori informazioni vedi: Tradurre un file SVG. |
| Descrizione |
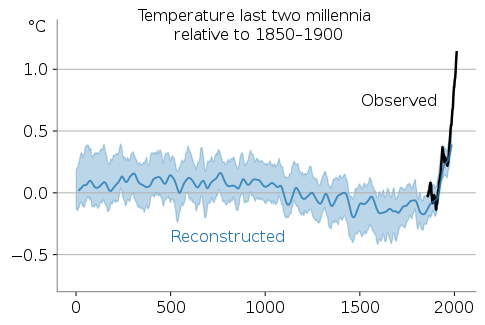
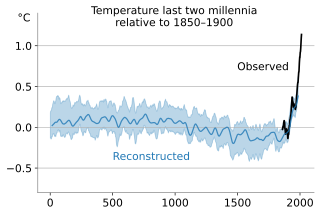
English: Temperatures with respect to the 1850–1900 mean over the last 2 millennia (blue) and observational estimates ranging from 1850 to 2020 (black). The shaded region contains the 68% confidence interval. The temperature anomalies are from the 2019 Nature Geoscience paper by the Pages2k Consortium.[1] using a wide set of proxies that have been vetted by the same consortium.[2] They include tree ring data, data from corals and ice core data.
The confidence interval incorporates two sources of uncertainty. The first one derives from the the method of translating information in the proxies into temperatures. Seven different peer-reviewed methods are employed and all considered equally likely in the figure. The methods range from a simple linear method where proxies sensitivities are fitted to the observational to determine past temperature, to more complicated methods in which information about spatial patterns is taken into account, or information about natural forcing is taken into account. The second type of uncertainty is in the selection of proxies. Some proxies might not be entirely reliable and their inclusion might slightly bias the reconstruction. By randomly selecting a subset of proxies, this uncertainty can be quantified. Code to create the figure is adapted from the Nature Geosciences paper[1] and can be found on https://figshare.com/collections/Global_mean_temperature_reconstructions_over_the_Common_Era/4507043. The figure is a simplification of Fig 1a from this paper. Individual reconstruction methods are not shown. The observational data is HadCRUT5, plotted with a ten-year running mean.[3] references
|
| Data | |
| Fonte | Opera propria |
| Autore | Femke Nijsse |
| Altre versioni |
The above two-millennia chart is included in the following composites:
Opere derivate da questo file: |


Licenza
- Tu sei libero:
- di condividere – di copiare, distribuire e trasmettere quest'opera
- di modificare – di adattare l'opera
- Alle seguenti condizioni:
- attribuzione – Devi fornire i crediti appropriati, un collegamento alla licenza e indicare se sono state apportate modifiche. Puoi farlo in qualsiasi modo ragionevole, ma non in alcun modo che suggerisca che il licenziante approvi te o il tuo uso.
- condividi allo stesso modo – Se remixi, trasformi o sviluppi il materiale, devi distribuire i tuoi contributi in base alla stessa licenza o compatibile all'originale.
Cronologia del file
Fare clic su un gruppo data/ora per vedere il file come si presentava nel momento indicato.
| Data/Ora | Miniatura | Dimensioni | Utente | Commento | |
|---|---|---|---|---|---|
| attuale | 19:37, 3 apr 2023 | | 485 × 325 (134 KB) | Aspere | File uploaded using svgtranslate tool (https://svgtranslate.toolforge.org/). Added translation for ko. |
| 12:18, 10 set 2022 |  | 485 × 325 (133 KB) | Theklan | File uploaded using svgtranslate tool (https://svgtranslate.toolforge.org/). Added translation for eu. | |
| 06:13, 9 gen 2022 |  | 485 × 325 (132 KB) | TAKAHASHI Shuuji | File uploaded using svgtranslate tool (https://svgtranslate.toolforge.org/). Added translation for ja. | |
| 13:51, 17 dic 2021 |  | 485 × 325 (131 KB) | Gabriel Kielland | File uploaded using svgtranslate tool (https://svgtranslate.toolforge.org/). Added translation for nb. | |
| 00:05, 15 dic 2021 |  | 485 × 325 (128 KB) | RCraig09 | 14 Dec 2021: per Talk page, nudging "Observed" to the right and anchoring at end of text so long-word translations will expand from right to left and not intersect the graph trace. | |
| 21:47, 7 dic 2021 |  | 485 × 325 (128 KB) | Chidgk1 | File uploaded using svgtranslate tool (https://svgtranslate.toolforge.org/). Added translation for tr. | |
| 17:19, 7 dic 2021 |  | 485 × 325 (124 KB) | GoEThe | File uploaded using svgtranslate tool (https://svgtranslate.toolforge.org/). Added translation for pt. | |
| 18:44, 3 dic 2021 |  | 485 × 325 (121 KB) | Femke | File uploaded using svgtranslate tool (https://svgtranslate.toolforge.org/). Added translation for nl. | |
| 18:42, 3 dic 2021 |  | 485 × 325 (121 KB) | Femke | File uploaded using svgtranslate tool (https://svgtranslate.toolforge.org/). Added translation for es. | |
| 18:33, 3 dic 2021 |  | 485 × 325 (122 KB) | Femke | Allow more space for translations |
Pagine che usano questo file
Le seguenti 5 pagine usano questo file:
Utilizzo globale del file
Anche i seguenti wiki usano questo file:
- Usato nelle seguenti pagine di af.wikipedia.org:
- Usato nelle seguenti pagine di ar.wikipedia.org:
- Usato nelle seguenti pagine di ast.wikipedia.org:
- Usato nelle seguenti pagine di ba.wikipedia.org:
- Usato nelle seguenti pagine di bg.wikipedia.org:
- Usato nelle seguenti pagine di bh.wikipedia.org:
- Usato nelle seguenti pagine di ca.wikipedia.org:
- Usato nelle seguenti pagine di en.wikipedia.org:
- Usato nelle seguenti pagine di en.wikibooks.org:
- Usato nelle seguenti pagine di eo.wikipedia.org:
- Usato nelle seguenti pagine di es.wikipedia.org:
- Usato nelle seguenti pagine di eu.wikipedia.org:
- Usato nelle seguenti pagine di fi.wikipedia.org:
- Usato nelle seguenti pagine di fr.wikipedia.org:
- Usato nelle seguenti pagine di gl.wikipedia.org:
- Usato nelle seguenti pagine di gu.wikipedia.org:
- Usato nelle seguenti pagine di he.wikipedia.org:
- Usato nelle seguenti pagine di hi.wikipedia.org:
- Usato nelle seguenti pagine di hu.wikipedia.org:
- Usato nelle seguenti pagine di ilo.wikipedia.org:
- Usato nelle seguenti pagine di kn.wikipedia.org:
- Usato nelle seguenti pagine di ko.wikipedia.org:
- Usato nelle seguenti pagine di la.wikipedia.org:
- Usato nelle seguenti pagine di lt.wikipedia.org:
- Usato nelle seguenti pagine di nl.wikipedia.org:
- Usato nelle seguenti pagine di no.wikipedia.org:
- Usato nelle seguenti pagine di pl.wikipedia.org:
- Usato nelle seguenti pagine di pt.wikipedia.org:
- Usato nelle seguenti pagine di pt.wikiquote.org:
- Usato nelle seguenti pagine di ru.wikipedia.org:
Visualizza l'utilizzo globale di questo file.