File:Köppen World Map (retouched version).png

File originale (4 231 × 2 804 pixel, dimensione del file: 1,05 MB, tipo MIME: image/png)
| Questo file e la sua pagina di descrizione (discussione · modifica) si trovano su Wikimedia Commons (?) |
.png?uselang=it)
.png)
.png&action=edit)
| Descrizione |
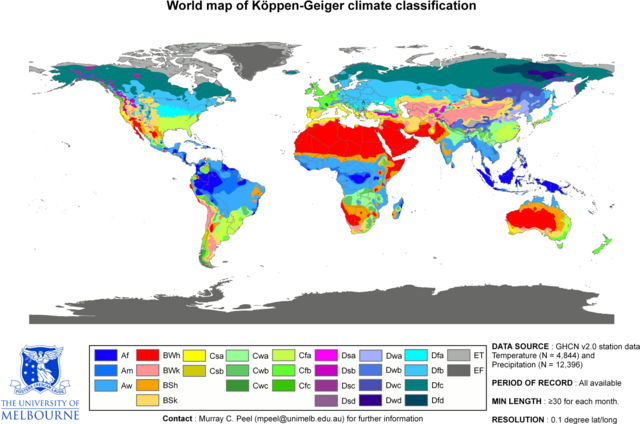
Updated world map of the Köppen-Geiger climate classification. العربية: خريطةٌ تصفُ وتُفصّل توزيع الأقاليم المناخيّة في العالَم. |
| Data | (UTC) |
| Fonte | |
| Autore |
|
| Licenza (Riusare questo file) |
| Questa è una immagine ritoccata, il che significa che è stata modificata digitalmente dalla sua versione originale. Modifiche: Climate change in 2009. La versione originale può essere vista qui: World Köppen Map.png. Le modifiche sono di Br-Sc-94.
|
- Tu sei libero:
- di condividere – di copiare, distribuire e trasmettere quest'opera
- di modificare – di adattare l'opera
- Alle seguenti condizioni:
- attribuzione – Devi fornire i crediti appropriati, un collegamento alla licenza e indicare se sono state apportate modifiche. Puoi farlo in qualsiasi modo ragionevole, ma non in alcun modo che suggerisca che il licenziante approvi te o il tuo uso.
- condividi allo stesso modo – Se remixi, trasformi o sviluppi il materiale, devi distribuire i tuoi contributi in base alla stessa licenza o compatibile all'originale.
Legend
Explanatory notes
Some explanations are given below about this map- File-Köppen Wörld Map (retouched version).png.[1]
Lack of recording stations: Alps, Temperate zone in South India
Extent of Temperate climate markings ( “C” zone) in South India
In map File:Köppen World Map (retouched version).png-The Temperate climate markings ( “C” zone) are larger in Tropical South India, around Kodaikanal which is on the eastern side of Western Ghats mountains in Tamil Nadu state, at a higher elevation (~2300m). And also the temperate climate markings extend further South than expected. This is due to recordings from temperature station at Kodaikanal & lack of recording stations from nearby lowland areas, so markings could not be corrected due to lack of data.[1]
Extent of Alps in Europe marked as E zone; (Himalayas-high mountains- not marked as “E” zone)
In map File:Köppen World Map (retouched version).png-Alps high mountains are marked as “E” zone in this map. But “E” zone markings in the map for the Alps- high mountains do not cover the extent expected, because of lack of recording stations.[1] In this map, Himalayas -high mountains- are not marked as “E” zone.
Another map from a different source, shows no "C" zone in South India, Himalayas high mountains marked as "E" zone
Another map with reliable source is in references list given below. This map is based on data sets from the Climatic Research Unit (CRU) of the University of East Anglia and the Global Precipitation Climatology Centre (GPCC) at the German Weather Service.This is a digital Köppen–Geiger world map[2] on climate classification for the second half of the 20th century.
World Map of the Köppen-Geiger climate classification updated
This map[2] shows no temperate "C" zone in tropical South India & Himalayas high mountains are marked as polar "E" zone.
References
- ↑ a b c Peel, M. C. and Finlayson, B. L. and McMahon, T. A. (2007). "Updated world map of the Köppen–Geiger climate classification". Hydrol. Earth Syst. Sci. 11: 1633–1644. DOI:10.5194/hess-11-1633-2007. ISSN 1027-5606. (direct: Final Revised Paper).
- ↑ a b c d Kottek, M., J. Grieser, C. Beck, B. Rudolf, and F. Rubel (2006). "World Map of the Köppen–Geiger climate classification updated". Meteorol. Z. 15 (3): 259–263. DOI:10.1127/0941-2948/2006/0130. Retrieved on 2013-06-01.(direct- Kottek 2006 Paper)
Registro originale del caricamento
This image is a derivative work of the following images:
- File:World Köppen Map.png licensed with Cc-by-sa-3.0
- 2010-03-05T23:41:54Z Aiyizo 4231x2804 (344162 Bytes) Cropped white space, compressed with pngout. I've also converted the image to indexed mode with an optimal 64 color palette. This introduces minor alaising effects to the region edges, but it gives a massive reduction in fi
- 2007-10-12T22:35:59Z Jeroencommons 4250x2815 (2188412 Bytes)
- 2007-10-12T22:05:31Z Jeroencommons 6708x4443 (3366169 Bytes) Citation: '''Peel, M. C., Finlayson, B. L., and McMahon, T. A.: Updated world map of the Köppen-Geiger climate classification, Hydrol. Earth Syst. Sci., 11, 1633-1644, 2007.''' {{Information |Description= Updated world map
Uploaded with derivativeFX
Related maps
User Jeroenvrp made for these continents and areas a cropped and resized version:
- Africa Köppen Map.png
- Asia Köppen Map.png
- Australia-Oceania Köppen Map.png
- Europe Köppen Map.png
- North America Köppen Map.png
- Russia Köppen Map.png
- South America Köppen Map.png
- West Asia Köppen Map.png.
User LordToran made from the same data these maps:
- Klimagürtel-der-erde-eisklima.png
- Klimagürtel-der-erde-gemäßigte-zone.png
- Klimagürtel-der-erde-polargebiete.png
- Klimagürtel-der-erde-subtropen.png
- Klimagürtel-der-erde-tropen.png
- Klimagürtel-der-erde-tundra.png
- Klimagürtel-der-erde-warmgemäßigte-zone.png
- Klimagürtel-der-erde.png
- Klimagürtel-der-erde.svg
- Klimate-humidität.png
- Köppen-geiger-hessd-2007.svg
- Köppen-vereinfacht.svg
- Trockenklimate.png
Cronologia del file
Fare clic su un gruppo data/ora per vedere il file come si presentava nel momento indicato.
| Data/Ora | Miniatura | Dimensioni | Utente | Commento | |
|---|---|---|---|---|---|
| attuale | 18:45, 20 feb 2018 | | 4 231 × 2 804 (1,05 MB) | Maphobbyist | The Costa Rican Central Valley has a dry winter oceanic climate (Köppen classification: Cwb) |
| 18:02, 20 feb 2018 |  | 4 231 × 2 804 (1,05 MB) | Maphobbyist | The Caspian coastal lowland of Iran has a humid subtropical climate (Köppen classification: Cfa). | |
| 14:44, 2 apr 2014 |  | 4 231 × 2 804 (784 KB) | Wolrd blank map | Adding Many Lakes in All Continents in four minutes, Painting many lakes in all continents as white | |
| 14:42, 2 apr 2014 |  | 4 231 × 2 804 (784 KB) | Wolrd blank map | Adding Many Lakes in All Continents, Painting many lakes in all continents as white. | |
| 14:38, 2 apr 2014 |  | 4 231 × 2 804 (784 KB) | Wolrd blank map | Added and painted the Region Lakes on Finland as white as it should have been, because the Köppen system is based on the concept that climate types are correlated with the natural vegetation. Thus with Köppen, climate zone boundaries have been select... | |
| 14:35, 2 apr 2014 |  | 4 231 × 2 804 (504 KB) | Wolrd blank map | Reverted to version as of 20:00, 22 September 2010 | |
| 14:15, 13 mar 2011 |  | 4 231 × 2 804 (784 KB) | Maphobbyist | Painted the Caspian Sea as white as it should have been, because the Köppen system is based on the concept that climate types are correlated with the natural vegetation. Thus with Köppen, climate zone boundaries have been selected with vegetation distri | |
| 22:00, 22 set 2010 |  | 4 231 × 2 804 (504 KB) | MPF | Some corrections in NW Europe | |
| 17:19, 18 lug 2010 |  | 4 231 × 2 804 (457 KB) | Br-Sc-94 | {{Information |Description=Updated world map of the Köppen-Geiger climate classification. |Source=*File:World_Koppen_Map.png |Date=2010-07-18 15:19 (UTC) |Author=*File:World_Koppen_Map.png: Peel, M. C., Finlayson, B. L., and McMahon, T. A.<br |
Pagine che usano questo file
Nessuna pagina utilizza questo file.
Utilizzo globale del file
Anche i seguenti wiki usano questo file:
- Usato nelle seguenti pagine di ar.wikipedia.org:
- Usato nelle seguenti pagine di be.wikipedia.org:
- Usato nelle seguenti pagine di bg.wikipedia.org:
- Usato nelle seguenti pagine di cs.wikipedia.org:
- Usato nelle seguenti pagine di cy.wikipedia.org:
- Usato nelle seguenti pagine di de.wikipedia.org:
- Usato nelle seguenti pagine di el.wikipedia.org:
- Usato nelle seguenti pagine di en.wikipedia.org:
- Usato nelle seguenti pagine di eo.wikipedia.org:
- Usato nelle seguenti pagine di eu.wikipedia.org:
- Usato nelle seguenti pagine di fa.wikipedia.org:
- Usato nelle seguenti pagine di gl.wikipedia.org:
- Usato nelle seguenti pagine di hr.wikipedia.org:
- Usato nelle seguenti pagine di ja.wikipedia.org:
- Usato nelle seguenti pagine di ka.wikipedia.org:
- Usato nelle seguenti pagine di mk.wikipedia.org:
- Usato nelle seguenti pagine di no.wikipedia.org:
- Usato nelle seguenti pagine di ro.wikipedia.org:
- Usato nelle seguenti pagine di sco.wikipedia.org:
- Usato nelle seguenti pagine di sh.wikipedia.org:
- Usato nelle seguenti pagine di sk.wikipedia.org:
- Usato nelle seguenti pagine di sl.wikipedia.org:
- Usato nelle seguenti pagine di sv.wikipedia.org:
- Usato nelle seguenti pagine di test2.wikipedia.org:
- Usato nelle seguenti pagine di th.wikipedia.org:
- Usato nelle seguenti pagine di zh-min-nan.wikipedia.org:
.png)