File:1982- Deaths from mass shootings in the U.S - scatterplot and line chart.svg
Vai alla navigazione
Vai alla ricerca

Dimensioni di questa anteprima PNG per questo file SVG: 800 × 600 pixel. Altre risoluzioni: 320 × 240 pixel | 640 × 480 pixel | 1 024 × 768 pixel | 1 280 × 960 pixel | 2 560 × 1 920 pixel | 1 000 × 750 pixel.
File originale (file in formato SVG, dimensioni nominali 1 000 × 750 pixel, dimensione del file: 4 KB)
| Questo file e la sua pagina di descrizione (discussione · modifica) si trovano su Wikimedia Commons (?) |
Dettagli
| Descrizione |
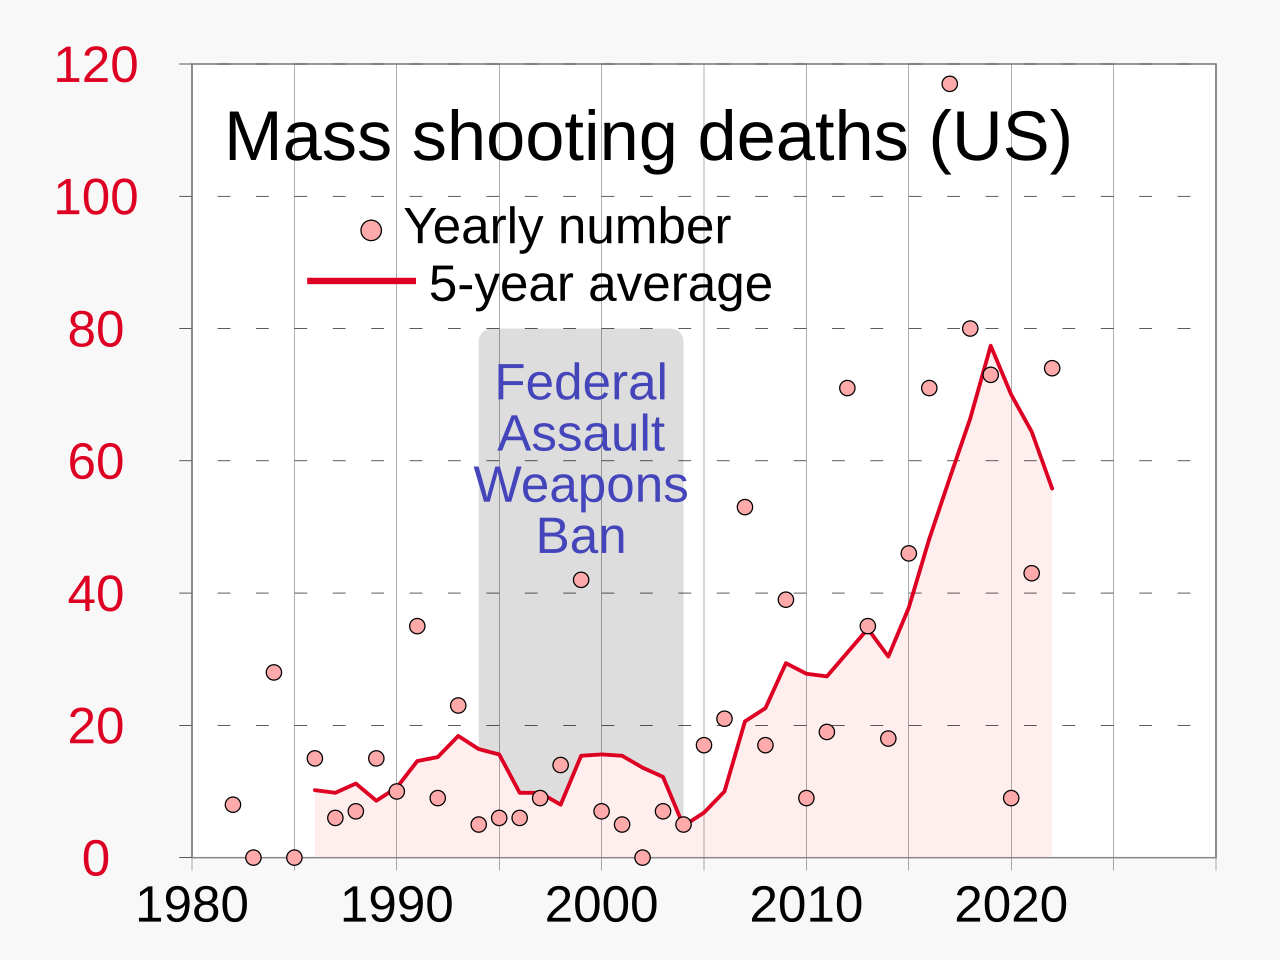
English: Chart showing deaths from mass shootings in the U.S., including 5-year moving average, beginning in 1982
|
||
| Data | |||
| Fonte | Opera propria | ||
| Autore | RCraig09 |

Related files
-
 Predecessor PNG file
 -
 Predecessor JPG file


Licenza
Io, detentore del copyright su quest'opera, dichiaro di pubblicarla con la seguente licenza:
Questo file è disponibile in base alla licenza Creative Commons Attribuzione-Condividi allo stesso modo 4.0 Internazionale
- Tu sei libero:
- di condividere – di copiare, distribuire e trasmettere quest'opera
- di modificare – di adattare l'opera
- Alle seguenti condizioni:
- attribuzione – Devi fornire i crediti appropriati, un collegamento alla licenza e indicare se sono state apportate modifiche. Puoi farlo in qualsiasi modo ragionevole, ma non in alcun modo che suggerisca che il licenziante approvi te o il tuo uso.
- condividi allo stesso modo – Se remixi, trasformi o sviluppi il materiale, devi distribuire i tuoi contributi in base alla stessa licenza o compatibile all'originale.
Cronologia del file
Fare clic su un gruppo data/ora per vedere il file come si presentava nel momento indicato.
| Data/Ora | Miniatura | Dimensioni | Utente | Commento | |
|---|---|---|---|---|---|
| attuale | 06:47, 4 apr 2023 | | 1 000 × 750 (4 KB) | RCraig09 | Version 3: add to legend |
| 05:46, 2 apr 2023 |  | 1 000 × 750 (4 KB) | RCraig09 | Version 2: reduce thickness of line trace to be less dominant (compatible with related charts) | |
| 23:43, 31 mar 2023 |  | 1 000 × 750 (4 KB) | RCraig09 | Uploaded own work with UploadWizard |
Pagine che usano questo file
La seguente pagina usa questo file:
Utilizzo globale del file
Anche i seguenti wiki usano questo file:
- Usato nelle seguenti pagine di cy.wikipedia.org:
- Usato nelle seguenti pagine di en.wikipedia.org:
- Usato nelle seguenti pagine di en.wikiquote.org:
- Usato nelle seguenti pagine di es.wikipedia.org:
- Usato nelle seguenti pagine di fr.wikipedia.org:
- Usato nelle seguenti pagine di he.wikipedia.org:
- Usato nelle seguenti pagine di id.wikipedia.org:
- Usato nelle seguenti pagine di ja.wikipedia.org:
- Usato nelle seguenti pagine di pl.wikipedia.org:
- Usato nelle seguenti pagine di pt.wikipedia.org:
- Usato nelle seguenti pagine di ru.wikipedia.org:
- Usato nelle seguenti pagine di vi.wikipedia.org:
- Usato nelle seguenti pagine di zh.wikipedia.org: