File:U.S. Home Ownership and Subprime Origination Share.png

File originale (960 × 720 pixel, dimensione del file: 29 KB, tipo MIME: image/png)
| Questo file e la sua pagina di descrizione (discussione · modifica) si trovano su Wikimedia Commons (?) |
Dettagli

|
Questa immagine (categorizzazione automatica: graph) o tutte le immagini in questa categoria o galleria dovrebbero essere ricreate usando grafica vettoriale come file SVG. Questo offre diversi vantaggi: vedi Commons:Media for cleanup per maggiori informazioni. Se è disponibile una versione in formato SVG di questa immagine, per favore caricala. Dopo aver caricato un file SVG, sostituisci questo avviso con il template {{Vector version available|nome_immagine.svg}}.
|
| Descrizione |
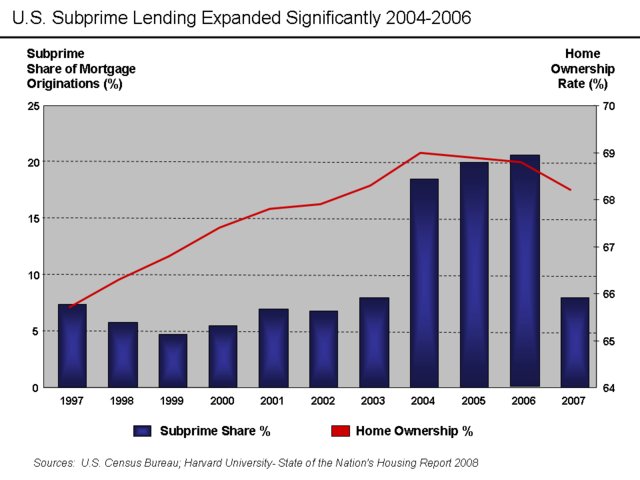
English: There are various mortgage categories defined based on the credit quality of the borrower. These include subprime, Alt-A, and Prime. The share of subprime mortgages is shown in the diagram. It is the ratio of the dollar value of subprime mortgages to all originations, expressed as a percentage. The level of home ownership is based on the percentage of American households that own homes rather than rent.
Subprime mortgages remained below 10% of all mortgage originations until 2004, when they spiked to nearly 20% and remained there through the 2005-2006 peak of the housing bubble.[1] A proximate event to this increase was the April 2004 decision by the SEC to relax the net capital rule, which encouraged the largest five investment banks to dramatically increase their financial leverage and aggressively expand their issuance of mortgage-backed securities. This applied additional competitive pressure to Fannie Mae and Freddie Mac, which further expanded their riskier lending.[2] Excerpts from the Harvard Report:
Other interpretations:
Source Data |
| Data | 30 maggio 2009 (data di caricamento originaria) |
| Fonte | Trasferito da en.wikipedia su Commons. |
| Autore | Farcaster di Wikipedia in inglese |
Licenza
- Tu sei libero:
- di condividere – di copiare, distribuire e trasmettere quest'opera
- di modificare – di adattare l'opera
- Alle seguenti condizioni:
- attribuzione – Devi fornire i crediti appropriati, un collegamento alla licenza e indicare se sono state apportate modifiche. Puoi farlo in qualsiasi modo ragionevole, ma non in alcun modo che suggerisca che il licenziante approvi te o il tuo uso.
- condividi allo stesso modo – Se remixi, trasformi o sviluppi il materiale, devi distribuire i tuoi contributi in base alla stessa licenza o compatibile all'originale.

|
È permesso copiare, distribuire e/o modificare questo documento in base ai termini della GNU Free Documentation License, Versione 1.2 o successive pubblicata dalla Free Software Foundation; senza alcuna sezione non modificabile, senza testo di copertina e senza testo di quarta di copertina. Una copia della licenza è inclusa nella sezione intitolata Testo della GNU Free Documentation License. |
Registro originale del caricamento
- 2009-05-30 23:44 Farcaster 960×720× (30085 bytes)
- 2009-05-30 23:16 Farcaster 960×720× (28829 bytes) {{Information |Description = Subprime mortgage share as % originations and home ownership rate |Source = [http://www.jchs.harvard.edu/publications/markets/son2008/son2008.pdf Harvard 2008 State of Nation's Housing Report] |Date = M
Cronologia del file
Fare clic su un gruppo data/ora per vedere il file come si presentava nel momento indicato.
| Data/Ora | Miniatura | Dimensioni | Utente | Commento | |
|---|---|---|---|---|---|
| attuale | 02:57, 14 ott 2010 | | 960 × 720 (29 KB) | Hideokun | {{Information |Description={{en|There are various mortgage categories defined based on the credit quality of the borrower. These include subprime, Alt-A, and Prime. The share of subprime mortgages is shown in the diagram. It is the ratio of the dollar va |
Pagine che usano questo file
La seguente pagina usa questo file:
Utilizzo globale del file
Anche i seguenti wiki usano questo file:
- Usato nelle seguenti pagine di de.wikipedia.org:
- Usato nelle seguenti pagine di el.wikipedia.org:
- Usato nelle seguenti pagine di en.wikipedia.org:
- Usato nelle seguenti pagine di fr.wikipedia.org:
- Usato nelle seguenti pagine di gu.wikipedia.org:
- Usato nelle seguenti pagine di hi.wikipedia.org:
- Usato nelle seguenti pagine di hy.wikipedia.org:
- Usato nelle seguenti pagine di ja.wikipedia.org:
- Usato nelle seguenti pagine di kn.wikipedia.org:
- Usato nelle seguenti pagine di lt.wikipedia.org:
- Usato nelle seguenti pagine di ta.wikipedia.org: