File:Temp-sunspot-co2.svg

File originale (file in formato SVG, dimensioni nominali 720 × 540 pixel, dimensione del file: 98 KB)
| Questo file e la sua pagina di descrizione (discussione · modifica) si trovano su Wikimedia Commons (?) |
Dettagli
| Descrizione |
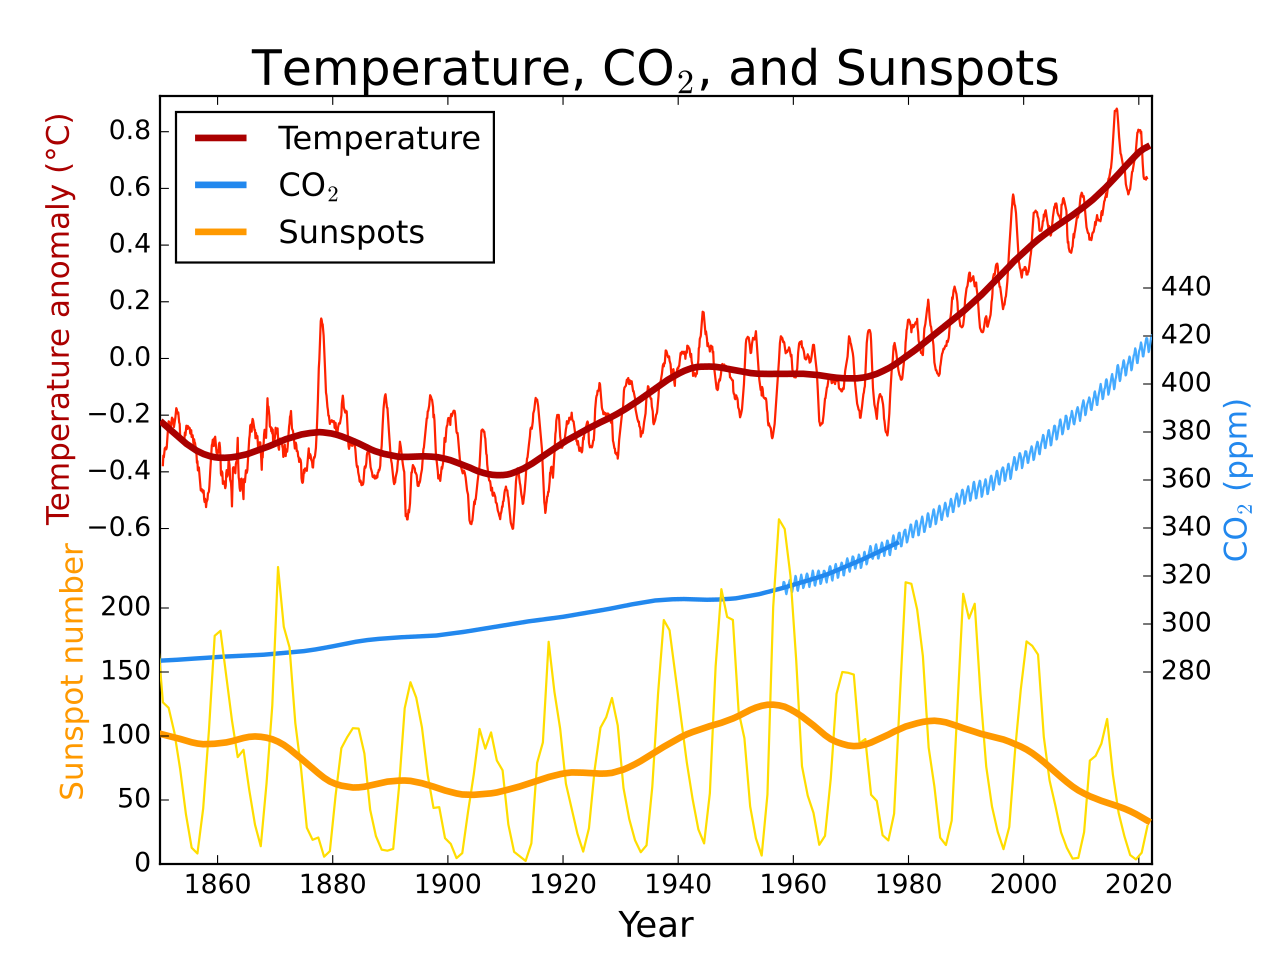
English: Global average temperature, atmospheric CO2, and sunspot activity since 1850. Thick lines for temperature and sunspots represent a 25 year LOWESS and moving average smoothing of the raw data. |
||
| Data | 11 gennaio 2009 (data di caricamento originaria) | ||
| Fonte | Trasferito da en.wikipedia su Commons da Anrie utilizzando CommonsHelper. | ||
| Autore | Leland McInnes di Wikipedia in inglese | ||
| Altre versioni |
|
||
| SVG sviluppo | Il codice sorgente di questo file SVG non è valido a causa di 1 errore.
Global average temperature, atmospheric CO2, and sunspot activity since 1850. Thick lines for temperature and sunspots represent a 25 year moving average smoothing of the raw data. This figure was produced by Leland McInnes using python and matplotlib and is licensed under the GFDL. All data is from publicly available sources.
| ||
| Codice sorgente | Python code#! /usr/bin/env python3
# -*- coding: utf-8 -*-
import numpy as np
import matplotlib.pylab as plt
import matplotlib.ticker as ticker
import urllib3
import ftplib
import shutil
plt.rcdefaults()
plt.style.use('classic')
def saveurl(url, fname):
if url.startswith("ftp"):
ftp = ftplib.FTP('/'.join(url.split('/')[2:3]))
ftp.login('', '')
with open(fname, 'wb') as f:
res = ftp.retrbinary('RETR %s' % '/'.join(url.split('/')[3:]), f.write)
else:
c = urllib3.PoolManager()
with c.request('GET', url, preload_content=False) as resp, open(fname, 'wb') as out_file:
shutil.copyfileobj(resp, out_file)
print('saved', fname, 'from', url)
def smooth_convolution(signal, window_size):
window_size = 1 + 2 * (window_size // 2) # should be odd
w = np.hamming(window_size)
y = (np.convolve(w, signal) / np.convolve(w, np.ones_like(signal)))
return y[(len(w)-1)//2:-(len(w)//2)]
def smooth_lowess(signal, window_size):
s = window_size // 2
window = np.hamming(1+2*s) / np.hamming(1+2*s).sum()
smoothed = np.empty_like(signal)
for i in range(len(signal)):
i0, i1 = max(i-s, 0), min(i+s, len(signal)-1) + 1
# linear LOWESS smoothing
smoothed[i] = np.poly1d(np.polyfit(np.arange(i0, i1), signal[i0:i1], deg=1,
w=np.sqrt(window[i0-i+s:i1-i+s])))(i)
return smoothed
saveurl("http://woodfortrees.org/data/hadcrut4gl/mean:12", "hadcrut4gl.txt")
with open("hadcrut4gl.txt") as temp_file:
temp_years, temps = [], []
for l in temp_file.readlines():
yT = l.split()
if (not l.startswith('#')) and len(yT) == 2:
temp_years.append(float(yT[0]))
temps.append(float(yT[1]))
#print('T', list(zip(temp_years, temps)))
saveurl("ftp://aftp.cmdl.noaa.gov/products/trends/co2/co2_mm_mlo.txt", "co2_mm_mlo.dat")
with open("co2_mm_mlo.dat") as co2_file:
data_rows = [x.split() for x in co2_file if not x.startswith("#") and x.find("-99.99") == -1]
co2_years = [float(x[2]) for x in data_rows]
co2concs = [float(x[3]) for x in data_rows]
#print('co2', list(zip(co2_years, co2concs)))
saveurl("ftp://ftp.ncdc.noaa.gov/pub/data/paleo/icecore/antarctica/law/law_co2.txt", "law_co2.txt")
with open("law_co2.txt", encoding="ISO-8859-1") as lawco2_file:
data_rows = [x.split() for x in lawco2_file if x.startswith(" 1")]
del data_rows[ [float(x[0]) for x in data_rows].index(1010.):]
lawco2_years = [float(x[0]) for x in data_rows]
lawco2concs = [float(x[-1]) for x in data_rows]
#print('lawco2', list(zip(lawco2_years, lawco2concs)))
saveurl("http://www.sidc.be/silso/DATA/SN_y_tot_V2.0.txt", "yearssn.dat")
with open("yearssn.dat") as sunspot_file:
data_rows = [x.split() for x in sunspot_file if "*" not in x]
sun_years = [float(x[0]) for x in data_rows]
sunspots = [float(x[1]) for x in data_rows]
#print('sunspots', list(zip(sun_years, sunspots)))
t_min, t_max = 1850, max(temp_years[-1], co2_years[-1], sun_years[-1])
smoothed_temps = smooth_lowess(temps, 25 * 12)
smoothed_sunspots = smooth_convolution(sunspots, 25)
rect = [0.125, 0.1, 0.775, 0.8]
base_ax = plt.axes(rect)
base_ax.yaxis.tick_left()
plt.yticks([])
plt.xlim(t_min, t_max)
plt.gca().xaxis.set_major_locator(ticker.MultipleLocator(20))
plt.xlabel("Year", size=16)
plt.title(r"Temperature, CO$_2$, and Sunspots", size=22)
temp_ax = plt.axes([rect[0],rect[1]+.42*rect[3],rect[2],.58*rect[3]], frameon=False)
temp_ax.yaxis.tick_left()
plt.plot(temp_years, temps, '#FF2200')
tline = plt.plot(temp_years, smoothed_temps, '#AA0000', lw=3)
plt.xlim(t_min, t_max)
plt.ylim(min(temps)*1.03 - 0.03*max(temps), max(temps)*1.03 - 0.03*min(temps))
plt.yticks(np.arange(-0.6,0.9,0.2))
plt.ylabel(u'Temperature anomaly (°C)', size=14, color='#AA0000')
plt.xticks([])
co2_ax = plt.axes([rect[0],rect[1]+.25*rect[3],rect[2],.5*rect[3]], frameon=False)
co2_ax.yaxis.tick_right()
co2_ax.yaxis.set_label_position("right")
co2_ax.xaxis.tick_bottom()
plt.plot(co2_years, co2concs, '#44AAFF')
cline = plt.plot(lawco2_years, lawco2concs, '#2288EE', lw=2)
plt.xlim(t_min, t_max)
plt.ylabel(r'CO$_2$ (ppm)', size=14, color='#2288EE')
plt.xticks([])
sun_ax = plt.axes([rect[0],rect[1],rect[2],.5*rect[3]], frameon=False)
sun_ax.yaxis.tick_left()
plt.plot(sun_years, sunspots, "#FFDD00")
sline = plt.plot(sun_years, smoothed_sunspots, "#FF9900", lw=3)
plt.xlim(t_min, t_max)
plt.yticks(np.arange(0,250,50))
plt.ylabel("Sunspot number", size=14, color='#FF9900')
plt.xticks([])
plt.sca(base_ax)
t_proxy = plt.Line2D([0], [0], c='#AA0000', lw=3)
c_proxy = plt.Line2D([0], [0], c='#2288EE', lw=3)
s_proxy = plt.Line2D([0], [0], c='#FF9900', lw=3)
plt.legend((t_proxy, c_proxy, s_proxy), ("Temperature", r"CO$_2$", "Sunspots"), loc="upper left")
plt.savefig("Temp-co2-sunspot.svg")
plt.show()
|


Related Images


Licenza
| Questo file è disponibile in base alla licenza Creative Commons Attribuzione-Condividi allo stesso modo 3.0 Unported Soggetto a disclaimer. | ||
| Attribuzione: Leland McInnes da en.wikipedia.org | ||
| ||
| Questo tag di copyright è stato aggiunto nell'ambito dell'aggiornamento della licenza dei progetti Wikimedia. |

|
È permesso copiare, distribuire e/o modificare questo documento in base ai termini della GNU Free Documentation License, Versione 1.2 o successive pubblicata dalla Free Software Foundation; senza alcuna sezione non modificabile, senza testo di copertina e senza testo di quarta di copertina. Una copia della licenza è inclusa nella sezione intitolata Testo della GNU Free Documentation License. Soggetto a disclaimer. |
Registro originale del caricamento
- 2009-01-11 03:45 Leland McInnes 720×540× (102750 bytes)
- 2008-10-09 00:57 Leland McInnes 600×480× (34962 bytes)
- 2007-03-11 02:47 Leland McInnes 600×480× (48910 bytes) Fix for wrong data selection
- 2007-03-11 02:10 Leland McInnes 600×480× (48672 bytes) Update to Had CRUT3 instead of CRUTEM
- 2007-03-10 20:46 Leland McInnes 600×480× (48525 bytes)
- 2007-03-10 20:41 Leland McInnes 600×480× (47761 bytes)
- 2007-03-10 05:01 Leland McInnes 600×480× (33704 bytes) Global average temperature, Mauna Loa CO<sub>2</sub>, and sunspot activity for the last 50 years.
Cronologia del file
Fare clic su un gruppo data/ora per vedere il file come si presentava nel momento indicato.
| Data/Ora | Miniatura | Dimensioni | Utente | Commento | |
|---|---|---|---|---|---|
| attuale | 22:23, 30 mag 2022 | | 720 × 540 (98 KB) | Geek3 | update 2022-04 |
| 15:11, 9 apr 2021 |  | 720 × 540 (106 KB) | Geek3 | update 2021-04 | |
| 15:04, 26 giu 2020 |  | 720 × 540 (105 KB) | Geek3 | data update 2020-05, enlarge temperature y-axis | |
| 17:10, 6 mar 2020 |  | 720 × 540 (107 KB) | Geek3 | update with 2020 data | |
| 00:15, 23 giu 2014 |  | 720 × 540 (76 KB) | Kopiersperre | switch from hadcrut3 to hadcrut4 | |
| 22:27, 11 mar 2014 |  | 720 × 540 (62 KB) | Kopiersperre | update | |
| 23:04, 25 giu 2012 |  | 731 × 551 (75 KB) | Johnanth | New version pulled from file discussion, based on the newly updated Python script. | |
| 20:38, 20 giu 2011 |  | 731 × 551 (69 KB) | Killiondude | http://m8y.org/tmp/wikipedia/ Someone was kind enough to use updated stats and redo it. | |
| 14:10, 4 mag 2009 |  | 720 × 540 (100 KB) | File Upload Bot (Magnus Manske) | {{BotMoveToCommons|en.wikipedia|year={{subst:CURRENTYEAR}}|month={{subst:CURRENTMONTHNAME}}|day={{subst:CURRENTDAY}}}} {{Information |Description={{en|__NOTOC__ Global average temperature, atmospheric CO<sub>2</sub>, and sunspot activity since 1850. Thi |
Pagine che usano questo file
La seguente pagina usa questo file:
Utilizzo globale del file
Anche i seguenti wiki usano questo file:
- Usato nelle seguenti pagine di be.wikipedia.org:
- Usato nelle seguenti pagine di bn.wikipedia.org:
- Usato nelle seguenti pagine di ca.wikipedia.org:
- Usato nelle seguenti pagine di de.wikipedia.org:
- Usato nelle seguenti pagine di en.wikipedia.org:
- Usato nelle seguenti pagine di en.wikiversity.org:
- Usato nelle seguenti pagine di es.wikipedia.org:
- Usato nelle seguenti pagine di fa.wikipedia.org:
- Usato nelle seguenti pagine di fr.wikipedia.org:
- Usato nelle seguenti pagine di hu.wikipedia.org:
- Usato nelle seguenti pagine di ig.wikipedia.org:
- Usato nelle seguenti pagine di ko.wikipedia.org:
- Usato nelle seguenti pagine di pt.wikipedia.org:
- Usato nelle seguenti pagine di ru.wikipedia.org:
- Usato nelle seguenti pagine di sr.wikipedia.org:
- Usato nelle seguenti pagine di tr.wikipedia.org:
- Usato nelle seguenti pagine di uk.wikipedia.org:
- Usato nelle seguenti pagine di zh.wikipedia.org: