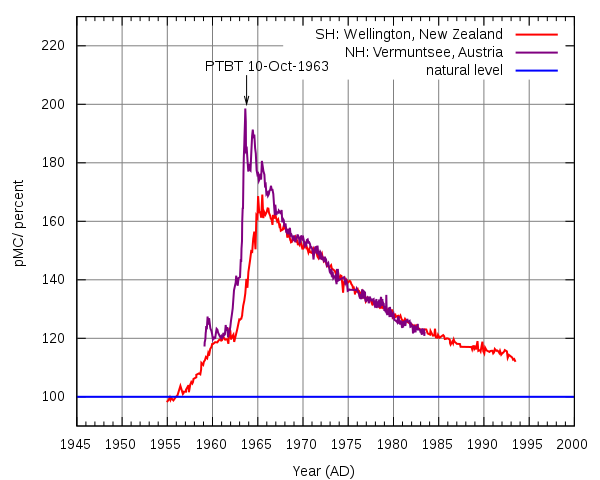
File:Radiocarbon bomb spike.svg
Vai alla navigazione
Vai alla ricerca

Dimensioni di questa anteprima PNG per questo file SVG: 600 × 480 pixel. Altre risoluzioni: 300 × 240 pixel | 960 × 768 pixel | 1 280 × 1 024 pixel | 2 560 × 2 048 pixel.
File originale (file in formato SVG, dimensioni nominali 600 × 480 pixel, dimensione del file: 27 KB)
Cronologia del file
Fare clic su un gruppo data/ora per vedere il file come si presentava nel momento indicato.
| Data/Ora | Miniatura | Dimensioni | Utente | Commento | |
|---|---|---|---|---|---|
| attuale | 16:32, 10 apr 2015 |  | 600 × 480 (27 KB) | Hokanomono | Increase line width. |
| 10:43, 9 apr 2015 |  | 600 × 480 (27 KB) | Hokanomono | Change green line to purple. | |
| 22:09, 5 apr 2011 |  | 600 × 480 (27 KB) | Hokanomono | Changed “Vermunt” to “Vermuntsee”. | |
| 15:30, 9 ago 2008 |  | 600 × 480 (27 KB) | Hokanomono | {{Information |Description= |Source= |Date= |Author= |Permission= |other_versions= }} | |
| 00:27, 15 mar 2006 |  | 600 × 480 (21 KB) | Hokanomono | This is a new version of Media:Atmospheric radiocarbon 1954-1993.svg. I have changed the title because I'm using additional data sources now. |
Pagine che usano questo file
Le seguenti 2 pagine usano questo file:
Utilizzo globale del file
Anche i seguenti wiki usano questo file:
- Usato nelle seguenti pagine di be.wikipedia.org:
- Usato nelle seguenti pagine di bg.wikipedia.org:
- Usato nelle seguenti pagine di ca.wikipedia.org:
- Usato nelle seguenti pagine di cs.wikipedia.org:
- Usato nelle seguenti pagine di cv.wikipedia.org:
- Usato nelle seguenti pagine di da.wikipedia.org:
- Usato nelle seguenti pagine di de.wikipedia.org:
- Radiokarbonmethode
- Kernwaffen-Effekt
- Vertrag über das Verbot von Kernwaffenversuchen in der Atmosphäre, im Weltraum und unter Wasser
- Portal:Chemie/Übersicht Lesenswerte Artikel
- Portal:Chemie/Artikelauszug/Radiokohlenstoffdatierung
- Diskussion:Radiokarbonmethode/Archiv/1
- Salted Bomb
- Portal:Physik/Artikel des Monats 2018-09
- Wikipedia Diskussion:Hauptseite/Artikel des Tages/Archiv/Vorschläge/2021/Q4
- Wikipedia:Hauptseite/Archiv/26. Dezember 2021
- Usato nelle seguenti pagine di en.wikipedia.org:
- Background radiation
- Partial Nuclear Test Ban Treaty
- Nuclear fallout
- Carbon-14
- Radioactive contamination
- User talk:Hokanomono
- Wikipedia:Reference desk/Archives/Science/2009 January 3
- User:Boundarylayer/sandbox
- Bomb pulse
- Wikipedia:WikiProject Wikipack Africa Content/Wikipedia:Showcase
- Wikipedia:WikiProject WikiFundi Content/Radiocarbon dating
- Wikipedia:WikiProject WikiFundi Content/Wikipedia:Showcase
- Usato nelle seguenti pagine di eo.wikipedia.org:
- Usato nelle seguenti pagine di es.wikipedia.org:
- Usato nelle seguenti pagine di et.wikipedia.org:
- Usato nelle seguenti pagine di fr.wikipedia.org:
- Usato nelle seguenti pagine di he.wikipedia.org:
- Usato nelle seguenti pagine di hi.wikipedia.org:
- Usato nelle seguenti pagine di hr.wikipedia.org:
- Usato nelle seguenti pagine di hu.wikipedia.org:
- Usato nelle seguenti pagine di hy.wikipedia.org:
- Usato nelle seguenti pagine di ja.wikipedia.org:
- Usato nelle seguenti pagine di ka.wikipedia.org:
Visualizza l'utilizzo globale di questo file.

