File:Blood values sorted by mass and molar concentration.png
File originale (6 798 × 977 pixel, dimensione del file: 2,46 MB, tipo MIME: image/png)
| Questo file e la sua pagina di descrizione (discussione · modifica) si trovano su Wikimedia Commons (?) |
|
Dettagli
| Descrizione |
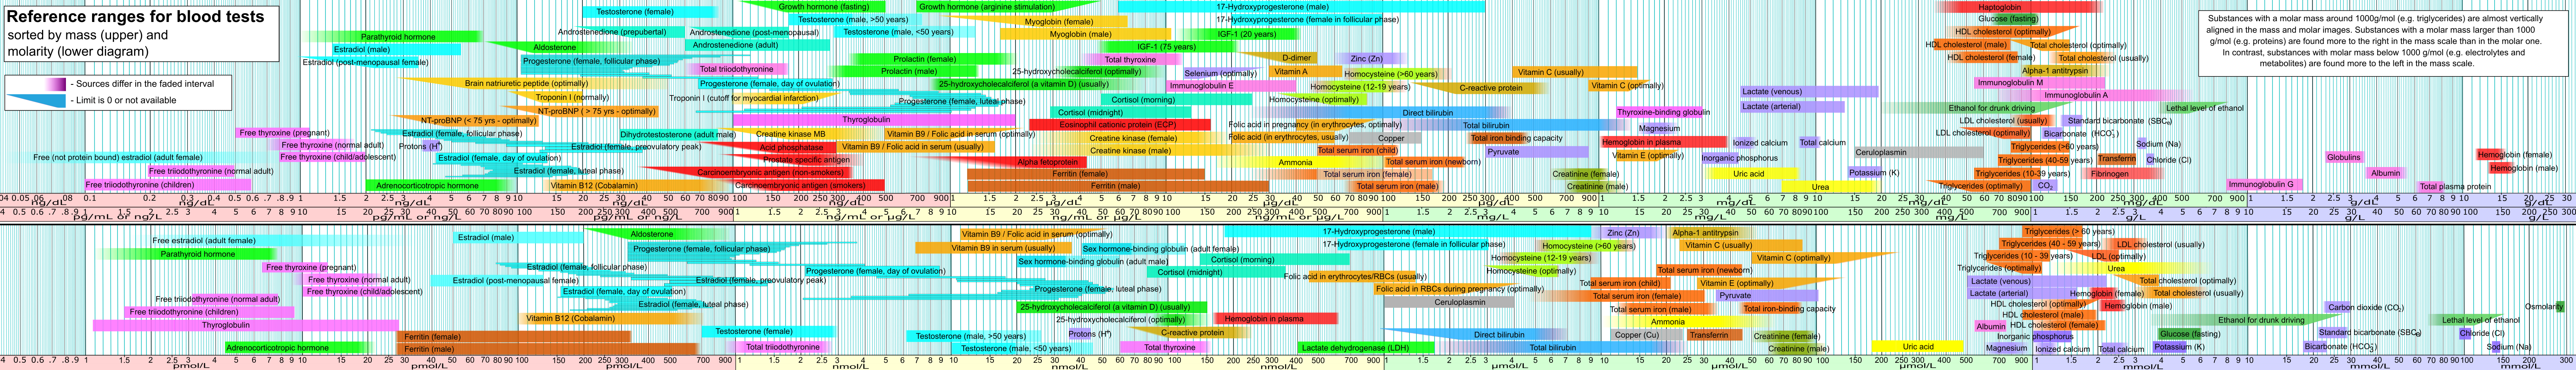
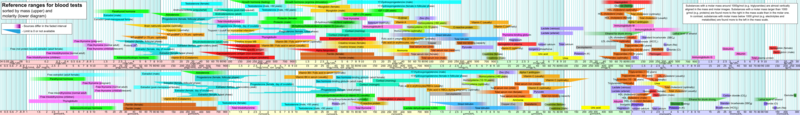
English: Reference ranges for blood tests, sorted by mass concentration and molar concentration.
ReferencesValues taken from Wikipedia article, with references and further description (or links to it) found there. Values through menstrual cycle for luteinizing hormone, follicle stimulating hormone, estradiol, and progesterone, however, are from:
Notes on individual substances
Original derivationThis image was originally created by a fusion of Image:Reference ranges for blood tests - by mass.png and Image:Reference ranges for blood tests - by molarity.png. Further informationFor more information, see article section en:Reference ranges for blood tests#Sorted by concentration. |
| Data | |
| Fonte | Opera propria - see also "References" section above |
| Autore | Mikael Häggström |
Blood values gallery
|
An overview of images showing reference ranges for blood tests sorted by amount.  Compound image, showing reference ranges sorted by mass and molar concentration. This is the most updated version. If the print preview of the Internet browser doesn't display the full image, then it may have to be downloaded and opened with another program. Vector (.svg) version is available.Also a version with blank boxes is available for translation or texting in HTML/CSS instead.  Vector (.svg) version is available, but is less updated than .png-version.  Vector (.svg) version is available, but is less updated than .png-version. | ||
   |
| |

.png)
Licenza
| Questo file è reso disponibile nei termini della licenza Creative Commons CC0 1.0 Universal. | |
| La persona che ha associato un'opera con questo atto legale ha donato tale opera nel pubblico dominio rinunciando a tutti i diritti sull'opera in tutto il mondo, inclusi tutti i diritti connessi o altri diritti simili, per quanto permesso dalla legge. Puoi copiare, modificare, distribuire ed utilizzare l'opera, anche a fini commerciali, senza chiedere alcun permesso.
|
Cronologia del file
Fare clic su un gruppo data/ora per vedere il file come si presentava nel momento indicato.
| Data/Ora | Miniatura | Dimensioni | Utente | Commento | |
|---|---|---|---|---|---|
| attuale | 02:40, 31 mag 2021 | 6 798 × 977 (2,46 MB) | Jul059 | Lossless file size reduction | |
| 20:03, 5 gen 2018 | 6 798 × 977 (2,95 MB) | Mikael Häggström | More clear separation of mass vs molarity | ||
| 11:43, 30 lug 2011 | 6 798 × 977 (2,68 MB) | Mikael Häggström | Added molar aldosterone. Clarified content in intro box. | ||
| 14:47, 15 apr 2011 | 4 985 × 716 (1,82 MB) | Mikael Häggström | Updated from svg version | ||
| 09:24, 29 mar 2011 | 4 985 × 716 (1,84 MB) | Mikael Häggström | corrected ages in IGF-1 | ||
| 09:18, 29 mar 2011 | 5 033 × 723 (1,88 MB) | Mikael Häggström | Added IGF-1. Updated prolactin values. | ||
| 21:26, 3 nov 2010 | 4 791 × 667 (1,67 MB) | Mikael Häggström | removed redundant info in infobox | ||
| 16:17, 8 ago 2010 | 4 791 × 667 (1,67 MB) | Mikael Häggström | Corrected mass sodium, added dihydrotestosterone | ||
| 17:37, 24 giu 2010 | 4 791 × 667 (1,68 MB) | Mikael Häggström | Removed misplaced "ethanol for drunk driving" | ||
| 08:36, 29 mag 2010 | 4 791 × 667 (1,68 MB) | Mikael Häggström | May update |
Pagine che usano questo file
La seguente pagina usa questo file:
Utilizzo globale del file
Anche i seguenti wiki usano questo file:
- Usato nelle seguenti pagine di ar.wikipedia.org:
- Usato nelle seguenti pagine di ast.wikipedia.org:
- Usato nelle seguenti pagine di bg.wikipedia.org:
- Usato nelle seguenti pagine di bn.wikipedia.org:
- Usato nelle seguenti pagine di bs.wikipedia.org:
- Usato nelle seguenti pagine di ca.wikipedia.org:
- Usato nelle seguenti pagine di cs.wikipedia.org:
- Usato nelle seguenti pagine di da.wikipedia.org:
- Usato nelle seguenti pagine di el.wikipedia.org:
- Usato nelle seguenti pagine di en.wikipedia.org:
- Cholesterol
- Fat
- Testosterone
- Adrenocorticotropic hormone
- Creatinine
- Bilirubin
- Pyruvic acid
- Lactic acid
- Reference ranges for blood tests
- Calcium in biology
- Globulin
- Transferrin
- Blood urea nitrogen
- Creatine kinase
- Ceruloplasmin
- Portal:Medicine
- Serum iron
- Total iron-binding capacity
- Transferrin saturation
- Thyroid function tests
- Acid phosphatase
Visualizza l'utilizzo globale di questo file.