File:GISS temperature 2000-09 lrg.png
Vai alla navigazione
Vai alla ricerca

Dimensioni di questa anteprima: 800 × 400 pixel. Altre risoluzioni: 320 × 160 pixel | 640 × 320 pixel | 1 024 × 512 pixel | 1 280 × 640 pixel | 2 880 × 1 440 pixel.
File originale (2 880 × 1 440 pixel, dimensione del file: 545 KB, tipo MIME: image/png)
| Questo file e la sua pagina di descrizione (discussione · modifica) si trovano su Wikimedia Commons (?) |
Dettagli
| Descrizione |
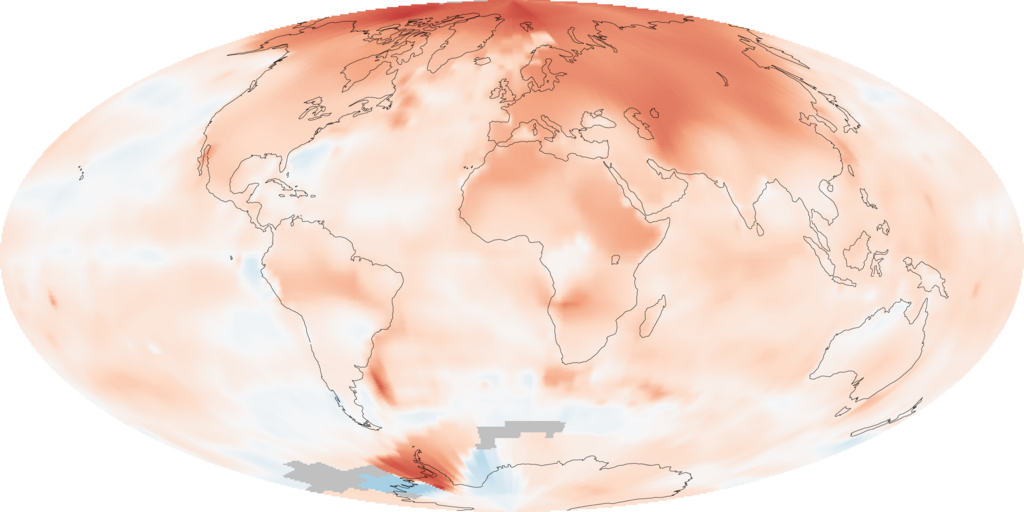
English: The map illustrates just how much warmer temperatures were in the decade (2000-2009) compared to average temperatures recorded between 1951 and 1980 (a common reference period for climate studies). The most extreme warming, shown in red, was in the Arctic. Very few areas saw cooler than average temperatures, shown in blue. Gray areas over parts of the Southern Ocean are places where temperatures were not recorded. The analysis, conducted by the Goddard Institute for Space Studies (GISS) in New York City, is based on temperatures recorded at meteorological (weather) stations around the world and satellite data over the oceans.
|
| Data | |
| Fonte | NASA Earth Observatory Image of the Day: 2009 Ends Warmest Decade on Record http://earthobservatory.nasa.gov/IOTD/view.php?id=42392 |
| Autore | NASA images by Robert Simmon, based on data from the Goddard Institute for Space Studies. |
Licenza
| Questo file è nel pubblico dominio perché creato dalla NASA. La politica sul copyright della NASA afferma che «il materiale della NASA non è protetto da copyright a meno che non sia specificato altrimenti». (NASA copyright policy e JPL Image Use Policy). | ||
 |
Attenzione:
|
Cronologia del file
Fare clic su un gruppo data/ora per vedere il file come si presentava nel momento indicato.
| Data/Ora | Miniatura | Dimensioni | Utente | Commento | |
|---|---|---|---|---|---|
| attuale | 05:09, 23 gen 2010 | | 2 880 × 1 440 (545 KB) | Petersam | {{Information |Description={{en|1=The map illustrate just how much warmer temperatures were in the decade (2000-2009) compared to average temperatures recorded between 1951 and 1980 (a common reference period for climate studies). The most extreme warming |
Pagine che usano questo file
La seguente pagina usa questo file:
Utilizzo globale del file
Anche i seguenti wiki usano questo file:
- Usato nelle seguenti pagine di ar.wikipedia.org:
- Usato nelle seguenti pagine di as.wikipedia.org:
- Usato nelle seguenti pagine di bn.wikipedia.org:
- Usato nelle seguenti pagine di bxr.wikipedia.org:
- Usato nelle seguenti pagine di cs.wikipedia.org:
- Usato nelle seguenti pagine di en.wikipedia.org:
- Usato nelle seguenti pagine di en.wikiversity.org:
- Usato nelle seguenti pagine di es.wikipedia.org:
- Usato nelle seguenti pagine di fa.wikipedia.org:
- Usato nelle seguenti pagine di fr.wikipedia.org:
- Usato nelle seguenti pagine di id.wikipedia.org:
- Usato nelle seguenti pagine di ilo.wikipedia.org:
- Usato nelle seguenti pagine di ko.wikipedia.org:
- Usato nelle seguenti pagine di or.wikipedia.org:
- Usato nelle seguenti pagine di pnb.wikipedia.org:
- Usato nelle seguenti pagine di pt.wikipedia.org:
- Usato nelle seguenti pagine di pt.wikinews.org:
- Usato nelle seguenti pagine di si.wikipedia.org:
- Usato nelle seguenti pagine di sv.wikipedia.org:
- Usato nelle seguenti pagine di uk.wikipedia.org:
- Usato nelle seguenti pagine di vi.wikipedia.org:
- Usato nelle seguenti pagine di www.wikidata.org:
- Usato nelle seguenti pagine di zh.wikipedia.org: